Category
Articles in the Business Visualization Workshop category.
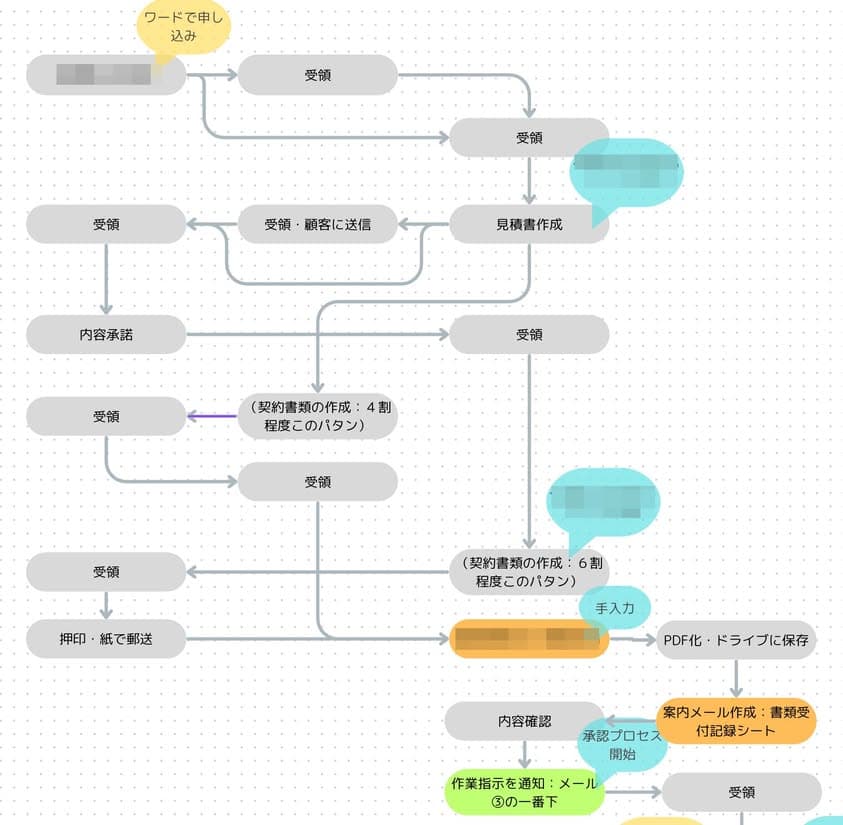
Recently, we had the opportunity to visualize the business workflow of a certain client. Their request stemmed from a challenge where detailed tasks that couldn't be handled by their core system were being managed manually through paper and Excel—creating complexity that they desperately wanted to resolve. Even mid-sized clients still rely heavily on paper and Excel on the front lines of their operations. Chat…
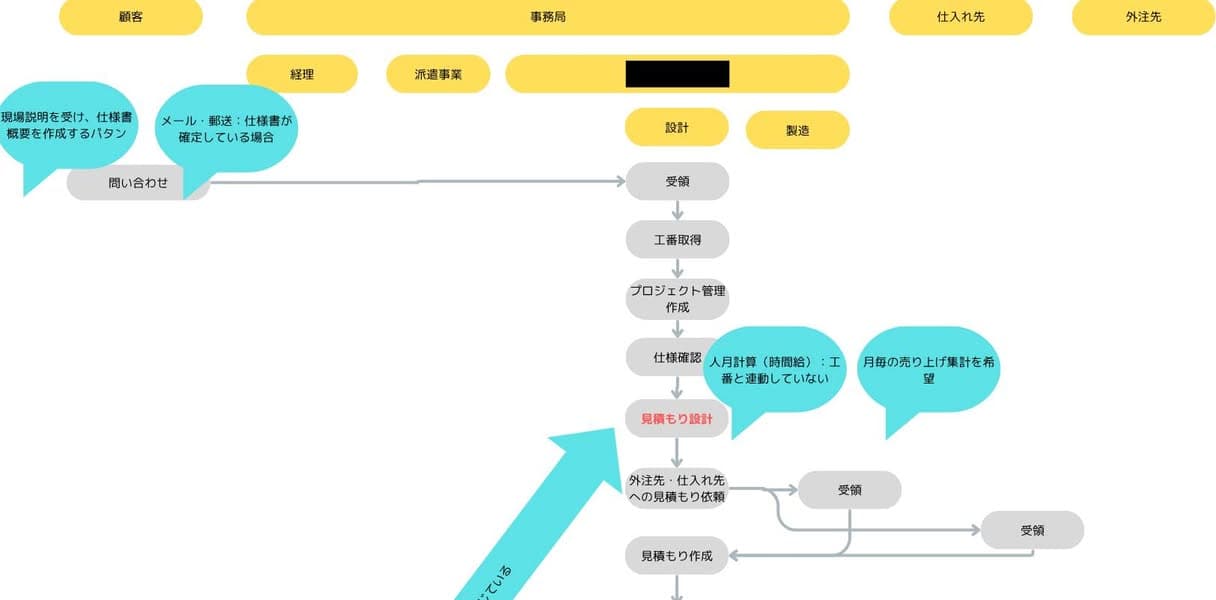
Let's talk business for a moment... That vague sense of inefficiency in your workflow? Simply mapping it out as a flowchart reveals about 80% of the problem. "This step has way too many procedures." "We're repeating the same thing here and here..." "Do we really need this approval?" There are countless insights you'll only discover once you visualize it. Visualization = a cost-effective tool...
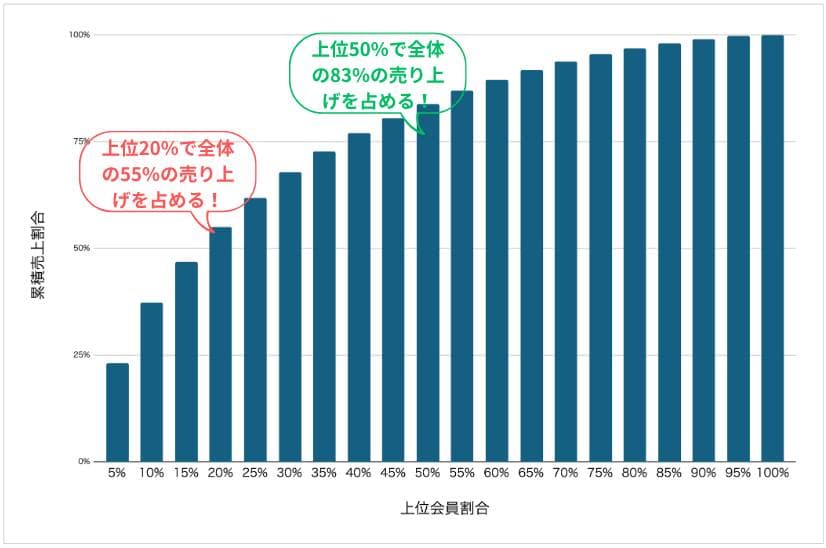
Do you know about the "Pareto Principle"? It's an empirical rule that states "80% of all results are produced by 20% of all elements." For example, it's like saying that 20% of employees generate 80% of sales. The other day, when I attended a general assembly (or something like it) at a certain business networking event, someone announced "We generated ○○ hundred million yen in sales!!!" and I thought...